项目简介 数据以及相关信息是在Kaggle上获取的
Credit Fraud || Dealing with Imbalanced Datasets | Kaggle
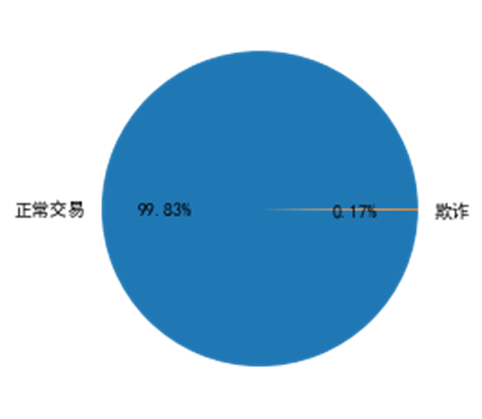
数据介绍 本数据集包含欧洲持卡人在2013年9月中的某两天发生的信用卡交易,其中 284,807 笔交易中有 492 笔欺诈。数据集展现出高度不平衡的性质,正类(欺诈)占所有交易的 0.17%。
1 2 3 4 5 df=pd.read_csv('creditcard.csv' ) print (len (df[df['Class' ]==0 ]),len (df[df["Class" ]==1 ]))plt.pie([len (df[df['Class' ]==0 ]),len (df[df["Class" ]==1 ])],labels=['正常交易' ,'欺诈' ],autopct= '%1.2f%%' ) plt.show()
整个数据包含Time、Amount、V1、V2、…V28以及Class共31个变量,其中出于保密原因,平台没有提供数据原始信息而是通过PCA处理后得到特征 V1、V2、… V28,唯一没有使用 PCA 转换的特征是时间(Time)和金额(Amount)。特征Time包含每个事务与数据集中第一个事务之间经过的秒数。特征Amount是交易金额,特征Class是响应变量,在欺诈的情况下取值为 1,否则为 0。
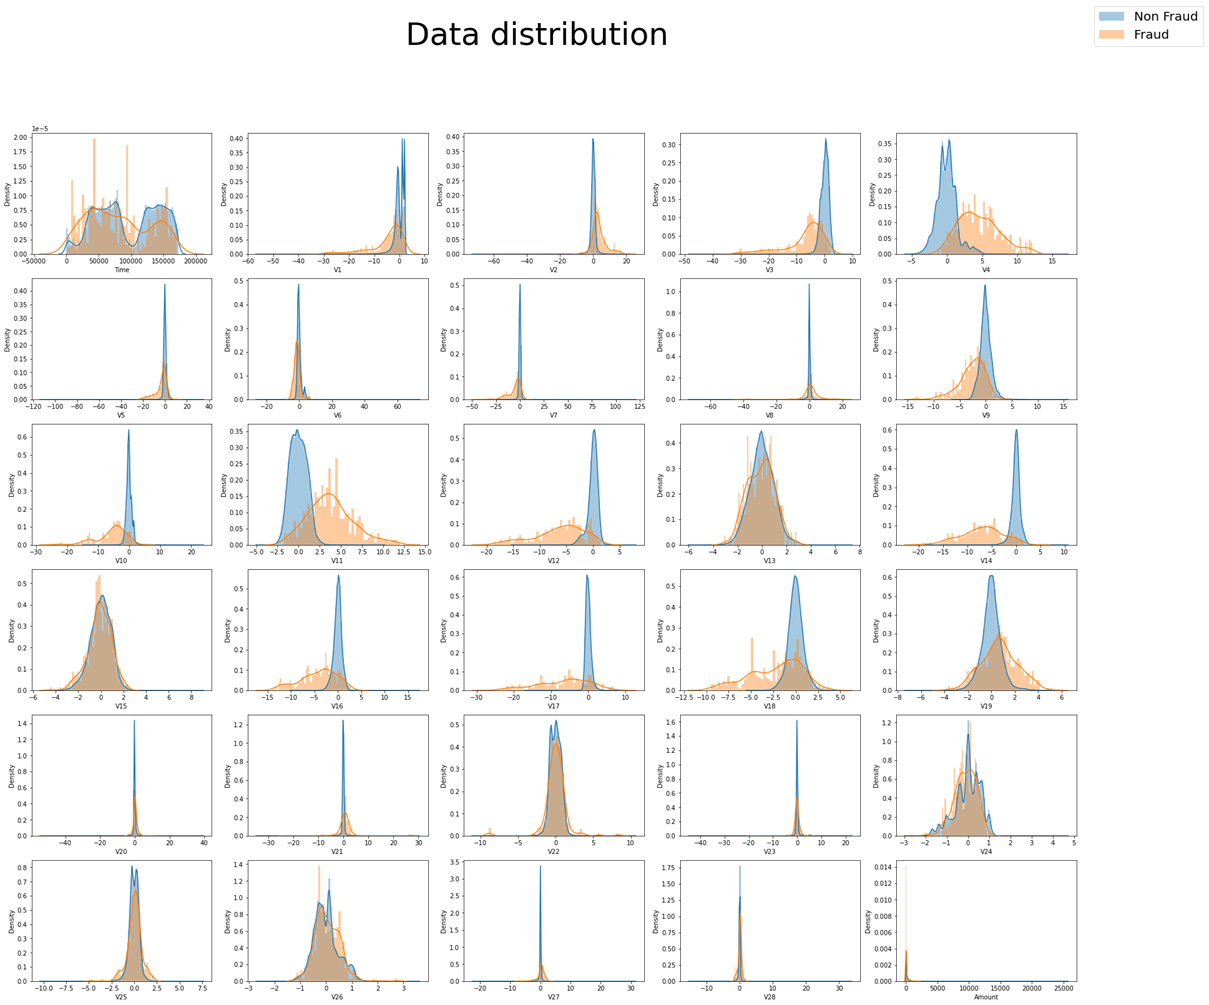
观察数据集中30个特征变量的分布情况,结果如图所示。其中蓝色代表非欺诈交易的分布情况,黄色代表欺诈情况的数据分布。可以观察到,除Time以外,其他特征均呈现单峰分布情况,考虑到数据集包含了两天时间的全部交易情况,Time特征在每一天应当也符合单峰分布。此外,可以明显观察到,欺诈与非欺诈在V6,V8,V13,V15,V20~V28这13个变量上分布特征极其相似,在之后的分类过程中,对于分类结果难以作出贡献,并会对分类器的效率造成影响,综合考虑之下,筛去这13个变量。
1 2 3 4 5 6 7 8 9 column=list (df.columns) fig=plt.figure(figsize=(30 ,25 )) fig.suptitle('Data distribution' ,fontsize=50 ) for i in range (30 ): plt.subplot(6 ,5 ,i+1 ) sns.distplot(df[df['Class' ]==0 ][column[i]],label='Non Fraud' ,bins=100 ) sns.distplot(df[df['Class' ]==1 ][column[i]],label='Fraud' ,bins=50 ) lines, labels = fig.axes[-1 ].get_legend_handles_labels() fig.legend(lines, labels, loc = 'upper right' ,fontsize=20 )
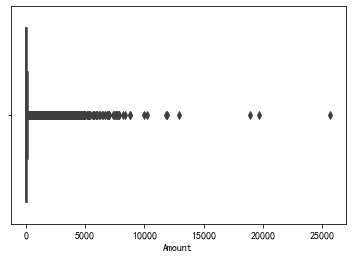
数据预处理 数据标准化 由于V1~V28这28个特征经过PCA处理后已经被归一化,具有零均值的特征,因此需要对时间以及数量两个特征进行标准化处理。数量特征的箱线图如图所示,有较多的离群点,为了防止标准化收到离群值较大影响,采用sklearn的RobustScaler标准化处理器进行标准化处理。
1 2 3 4 5 6 7 8 sns.boxplot(x=df['Amount' ], y=None , hue=None , data=None , order=None , hue_order=None , orient=None , color=None , palette=None , saturation=0.75 , width=0.8 , dodge=True , fliersize=5 , linewidth=None , whis=1.5 , ax=None ) rob_scaler = RobustScaler() df[['Time' ,'Amount' ]] = rob_scaler.fit_transform(df[['Time' ,'Amount' ]].values.reshape(-1 ,2 ))
数据重采样 不平衡分类一直是分类研究中的一个重要部分,目前学界有一些受广泛认同的处理方式,首先是对数据数量进行初步处理,常用的有过采样与欠采样两种处理方式。
随机过采样就是增加数据中少数类样本,使得正、反例数目接近,然后再进行学习。由于需要对少数类样本进行复制来扩大数据集,造成模型训练复杂度加大;同时也会造成模型的过拟合,因为随机过采样是简单的对初始样本进行复制采样,这就使得学习器学得的规则过于具体化,不利于学习器的泛化性能,造成过拟合问题。同时,过采样是重复正比例数据,实际上没有为模型引入更多数据,过分强调正比例数据,会放大正比例噪音对模型的影响。
欠采样即去除多数类中的一些样本使得正例、反例数目接近,然后再进行学习。这种方法由于采样的样本集合要少于原来的样本集合,因此会造成信息缺失,造成分类器表现不佳。
综合上述原因以及分类任务目标,决定使用过采样代表性(SMOTE)算法,SMOTE全称是Synthetic Minority Oversampling,即合成少数类过采样技术。是对随机过采样方法的一个改进算法:对每个少数类样本xi,从它的最近邻中随机选择一个样本x̅i,x̅i是少数类中的一个样本,然后在xi和x̅i之间的连线上随机选择一个点作为新合成的少数样本类。SMOTE算法摒弃了随机过采样复制样本的做法,可以防止随机过采样中容易过拟合的问题。
模型选择 多个模型对比 经过SMOTE算法进行过采样后,便可通过特征对样本进行分类学习。目前分类的策略多种多样,有基于规则的决策树分类,以及多个决策树形成的随机森林分类器;也有基于贝叶斯概率的贝叶斯分类器;还有基于回归的Logistic分类器;基于聚类的K-邻近聚类分类器等。
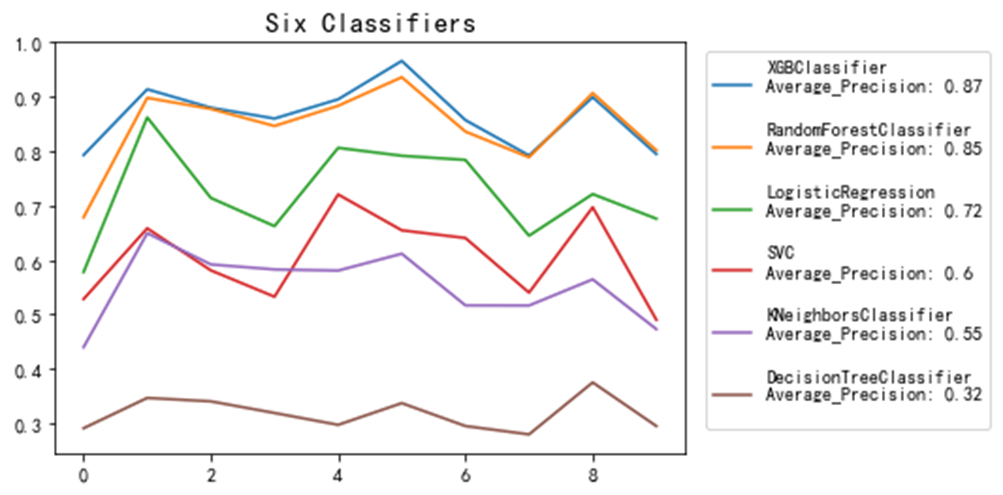
这里,我选择了DecisionTreeClassifier、LogisticRegression、KNeighborsClassifier、RandomForestClassifier、XGBClassifier、SVC六种分类器进行试验,并采用分层K折的方式对模型的AP值进行比较,选取效果最好的模型进行进一步调优。
对于一个模型分类结果好坏的评估,有多种方式,包括精确率(Precision),召回率(Recall)以及ROC曲线下面积(AUC)等等。考虑到数据具有较高的不平衡性,并结合比赛平台给出的建议,我使用AP值,即PR曲线下面积(Area Under Precision-Recall Curve)来衡量模型的质量。
1
2
3
4
5
6
7
8
9
10
11
12
13
14
from sklearn.model_selection import cross_val_scorefrom sklearn.model_selection import StratifiedKFoldfrom sklearn.tree import DecisionTreeClassifierfrom imblearn.pipeline import Pipelinefrom imblearn.over_sampling import SMOTEsteps = [('over' , SMOTE()), ('model' , DecisionTreeClassifier())] pipeline = Pipeline(steps=steps) cv = StratifiedKFold(n_splits=10 ,shuffle=True ,random_state=37 ) scores = cross_val_score(pipeline, X, y, scoring='average_precision' , cv=cv, n_jobs=4 ) plt.plot(scores) plt.show()
1
2
3
4
5
6
7
8
9
from sklearn.linear_model import LogisticRegressionsteps = [('over' , SMOTE()), ('model' , LogisticRegression())] pipeline = Pipeline(steps=steps) cv = StratifiedKFold(n_splits=10 ,shuffle=True ,random_state=37 ) scores1 = cross_val_score(pipeline, X, y, scoring='average_precision' , cv=cv, n_jobs=4 ) plt.plot(scores1) plt.show()
1
2
3
4
5
6
7
8
9
10
from sklearn.svm import SVCsteps = [('over' , SMOTE()), ('model' , SVC())] pipeline = Pipeline(steps=steps) cv = StratifiedKFold(n_splits=10 ,shuffle=True ,random_state=37 ) scores2 = cross_val_score(pipeline, X, y, scoring='average_precision' , cv=cv, n_jobs=4 ) plt.plot(scores2) plt.show()
1
2
3
4
5
6
7
8
9
from sklearn.neighbors import KNeighborsClassifiersteps = [('over' , SMOTE()), ('model' , KNeighborsClassifier())] pipeline = Pipeline(steps=steps) cv = StratifiedKFold(n_splits=10 ,shuffle=True ,random_state=37 ) scores3 = cross_val_score(pipeline, X, y, scoring='average_precision' , cv=cv, n_jobs=4 ) plt.plot(scores3) plt.show()
1
2
3
4
5
6
7
8
9
from sklearn.naive_bayes import MultinomialNBsteps = [('over' , SMOTE()), ('model' , MultinomialNB())] pipeline = Pipeline(steps=steps) cv = StratifiedKFold(n_splits=10 ,shuffle=True ,random_state=37 ) scores4 = cross_val_score(pipeline, X, y, scoring='average_precision' , cv=cv, n_jobs=4 ) plt.plot(scores4) plt.show()
1
2
3
4
5
6
7
8
9
from sklearn.ensemble import RandomForestClassifiersteps = [('over' , SMOTE()), ('model' , RandomForestClassifier())] pipeline = Pipeline(steps=steps) cv = StratifiedKFold(n_splits=10 ,shuffle=True ,random_state=37 ) scores5 = cross_val_score(pipeline, X, y, scoring='average_precision' , cv=cv, n_jobs=4 ) plt.plot(scores5) plt.show()
1
2
3
4
5
6
7
8
9
10
11
12
13
14
15
16
17
18
from xgboost.sklearn import XGBClassifierxgb_best = XGBClassifier( learning_rate =0.01 , n_estimators=957 , max_depth=9 , min_child_weight=1 , gamma=0.05 , subsample=0.9 , colsample_bytree=0.6 , reg_alpha=0.01 , reg_lambda=1 , objective= 'binary:logistic' , nthread=4 , scale_pos_weight=1 , seed=27 ) steps = [('over' , SMOTE()), ('model' , xgb_best)] pipeline = Pipeline(steps=steps) cv = StratifiedKFold(n_splits=10 ,shuffle=True ,random_state=37 ) scores6 = cross_val_score(pipeline, X, y, scoring='average_precision' , cv=cv, n_jobs=4 ) plt.plot(scores6) plt.show()
各个分类器的效果:
通过上述方法对模型进行K折验证,发现随机森林与XGBoost的预测效果明显优于其他分类器。考虑到XGBoost已被证明推动了提升树算法的计算能力极限,通过调参容易获得更好的结果,因此我们最终选择了XGBoost模型。
关于XGBoost的一些知识可以参考:
模型调参 确定估计器数目 估计模型参数时,使用XGBoost模块的cv函数,这个函数可以在每一次迭代中使用交叉验证,并返回理想的决策树数量。最终我们可以从训练结果中得知在当前参数下最合适的估计器数量。
为了确定估计器数目,我们要先给其他参数一个初始值。max_depth参数取值一般位于3-10之间,设定其起始值为5;由于信用卡交易欺诈分类是极度不平衡的问题,某些叶子节点下的值会比较小,因此将min_child_weight设置为1,取一个较小的值;设置gamma为一个较小的值0,这是在模型调优过程中较为常用的取值;设置subsample=0.8,colsample_bytree = 0.8,这两个参数取值范围一般在0.5-0.9之间,一般在参数调优时设置为0.8;为了加快不平衡问题种模型的收敛速度,设置scale_pos_weight取值为1。
最终,最优估计器数目为98个。
1
2
3
4
5
6
7
8
9
10
11
12
13
14
15
16
17
18
19
20
21
22
23
24
25
26
27
28
29
30
31
32
33
34
35
36
37
38
39
40
41
42
43
44
45
46
47
def modelfit (alg, X_train, y_train, X_test, y_test, useTrainCV=True , cv_folds=5 , early_stopping_rounds=50 ): xgb_param = alg.get_xgb_params() xgtrain = xgb.DMatrix(X_train.values, label=y_train.values) xgtest = xgb.DMatrix(X_test.values) cvresult = xgb.cv( xgb_param, xgtrain, num_boost_round=alg.get_params()['n_estimators' ], nfold=cv_folds, early_stopping_rounds=early_stopping_rounds, ) alg.set_params(n_estimators=cvresult.shape[0 ]) alg.fit(X_train, y_train, eval_metric='auc' ) dtrain_predictions = alg.predict(X_train) y_score = alg.predict_proba(X_test)[:,1 ] ap=average_precision_score(y_test,y_score) print ("\n关于现在这个模型" ) print ("准确率 : %.4g" % metrics.accuracy_score(y_train.values, dtrain_predictions)) print ("AP 得分 (训练集): %f" % ap) print ('n_estimators=' ,cvresult.shape[0 ]) print (cvresult) return (alg.feature_importances_,list (X_train.columns)) def tun_parameters (X_train,y_train,X_test,y_test ): xgb1 = XGBClassifier(learning_rate=0.1 ,n_estimators=150 ,max_depth=5 ,min_child_weight=1 ,gamma=0 ,subsample=0.8 , colsample_bytree=0.8 ,objective= 'binary:logistic' ,nthread=4 ,scale_pos_weight=1 ,seed=27 ) modelfit(xgb1, X_train,y_train,X_test,y_test) a=tun_parameters(X_train,y_train,X_test,y_test)
使用网格搜索(GridSearchCV)进行参数调优 网格搜索其实分为两个部分,即网格搜索(GridSearch)和交叉验证(CV)。网格搜索,搜索的是参数,即在指定的参数范围内,按步长依次调整参数,利用调整的参数训练学习器,从所有的参数中找到在验证集上精度最高的参数,这其实是一个训练和比较的过程。
GridSearchCV可以保证在指定的参数范围内找到精度最高的参数,但是这也是网格搜索的缺陷所在,他要求遍历所有可能参数的组合,在面对大数据集和多参数的情况下,非常耗时。
考虑到本模型需要调整的参数为gamma、subsample、colsample_bytree以及alpha和beta两个正则化参数共五个参数,数量并不大,且可以进行分组分别进行调优,因此选用此方法进行调参。
1
2
3
4
5
6
7
8
9
10
11
12
13
14
15
16
17
18
19
20
21
22
23
24
25
26
27
28
29
30
31
32
33
34
param_test1 = { 'max_depth' :[9 ,10 ,11 ], 'min_child_weight' :[0 ,1 ] } gsearch1 = GridSearchCV( estimator=XGBClassifier( learning_rate =0.1 , n_estimators=98 , max_depth=5 , min_child_weight=1 , gamma=0 , subsample=0.8 ,colsample_bytree=0.8 , objective= 'binary:logistic' , nthread=4 ,scale_pos_weight=1 , seed=27 ), param_grid=param_test1, scoring='average_precision' , iid=False , cv=5 ) gsearch1.fit(X_train,y_train) print (gsearch1.best_params_,gsearch1.best_score_)param_test3 = { 'gamma' : [i / 20.0 for i in range (0 , 16 )] } param_test4 = { 'subsample' : [i / 10.0 for i in range (6 , 10 )], 'colsample_bytree' : [i / 10.0 for i in range (6 , 10 )] } param_test6 = { 'reg_alpha' :[1e-5 , 1e-2 , 0.1 , 1 , 100 ] } param_test8 = { 'reg_lambda' : [1e-5 , 1e-2 , 0.1 , 1 , 100 ] }
最终得到最优参数:
1
2
3
4
5
6
7
8
xgb_best = XGBClassifier( learning_rate =0.01 , n_estimators=957 , max_depth=9 , min_child_weight=1 , gamma=0.05 , subsample=0.9 , colsample_bytree=0.6 , reg_alpha=0.01 , reg_lambda=1 , objective= 'binary:logistic' , nthread=4 , scale_pos_weight=1 , seed=27 )
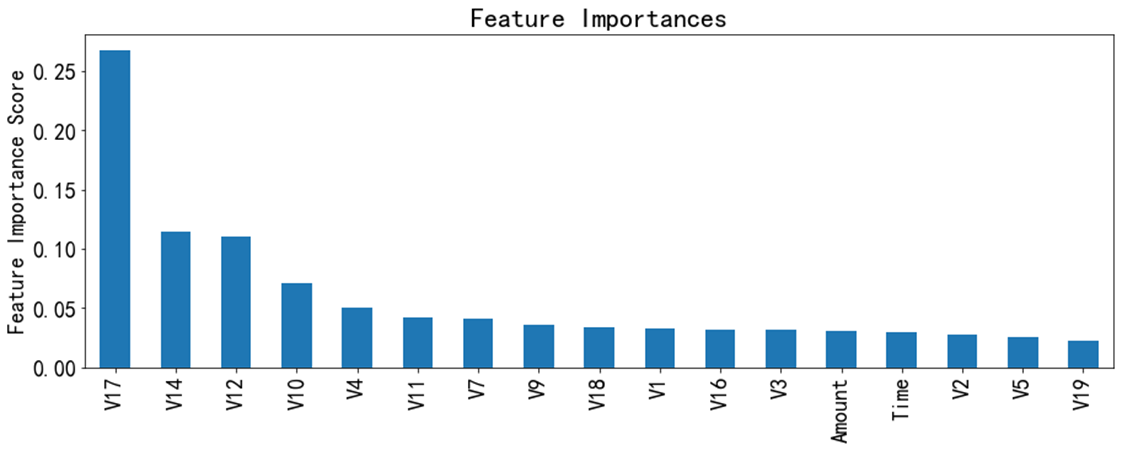
最终模型结果 决策树的学习最耗时的一个步骤就是对特征的值进行排序(因为决策树模型要确定最佳分割点,因此其最重要的一个步骤就是退特征的值进行排序,我训练的XGBoost模型的各个特征重要性排序结果如下:
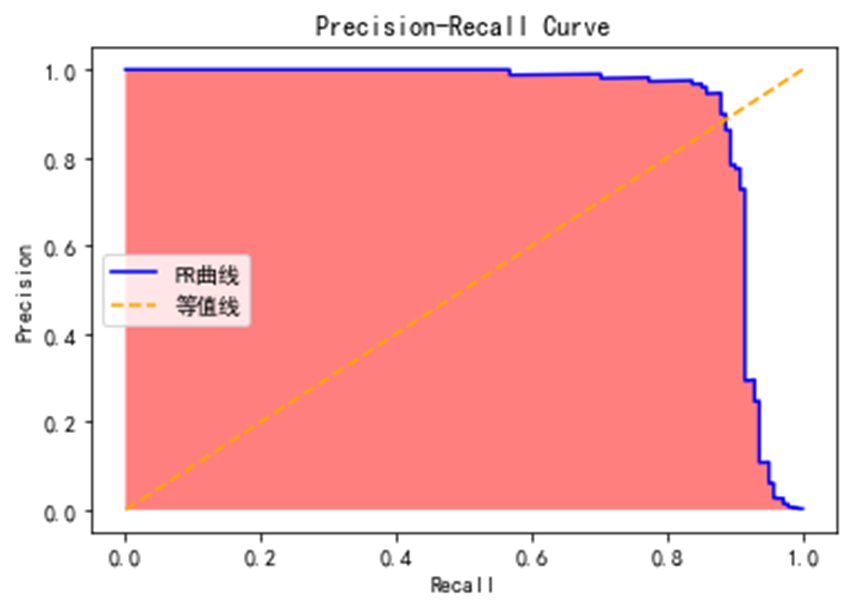
P-R曲线刻画查准率(Precision)和查全率(Recall)之间的关系,查准率指的是在所有预测为正例的数据中,真正例所占的比例,查全率是指预测为真正例的数据占所有正例数据的比例。查准率和查全率是一对矛盾的度量,一般来说,查准率高时,查全率往往偏低,查全率高时,查准率往往偏低。
在很多情况下,我们可以根据学习器的预测结果对样例进行排序,排在前面的是学习器认为最可能是正例的样本,排在后面的是学习器认为最不可能是正例的样本,按此顺序逐个把样本作为正例进行预测,则每次可计算当前的查全率和查准率,以查准率为y轴,以查全率为x轴,可以画出P-R曲线。
本模型的PR曲线效果如下,曲线下面积(AUPRC)为0.91:
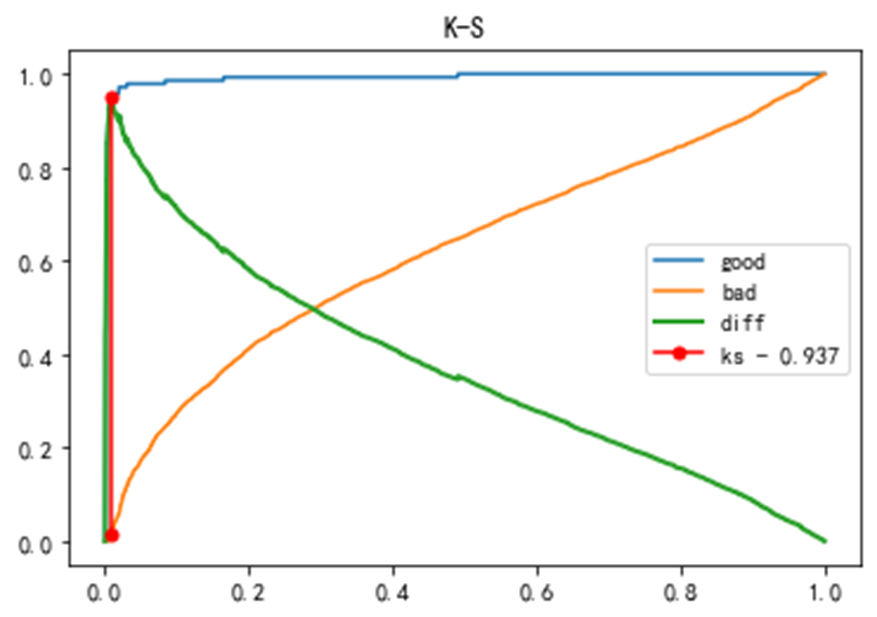
K-S曲线,又称作洛伦兹曲线。实际上,K-S曲线的数据来源以及本质和ROC曲线是一致的,只是ROC曲线是把真正率(TPR)和假正率(FPR)当作横纵轴,而K-S曲线是把真正率(TPR)和假正率(FPR)都当作是纵轴,横轴则由选定的阈值来充当。本模型的K-S值为0.937,模型的区分能力较强。
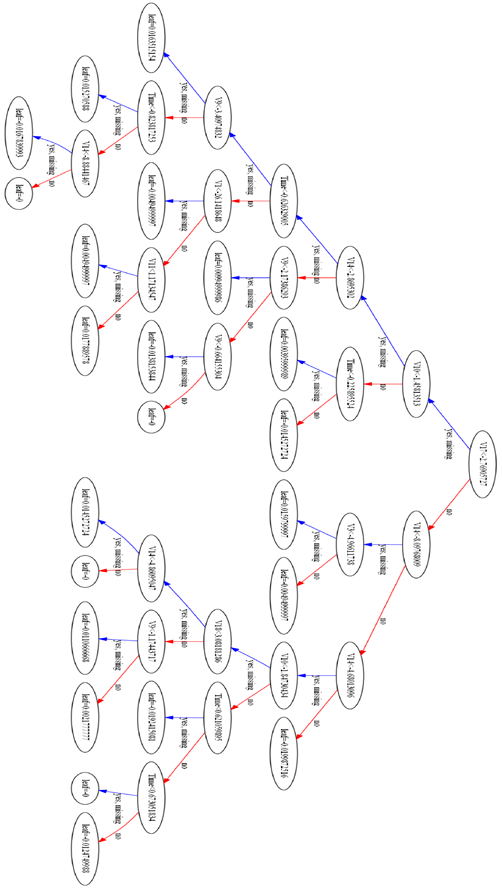
最终树结构

